Layers tab overview
The Layers tab is where you build the visible content of your APEx Geospatial Explorer — every map layer, its data source(s), how it is styled, and where it appears in the UI.
Follow along
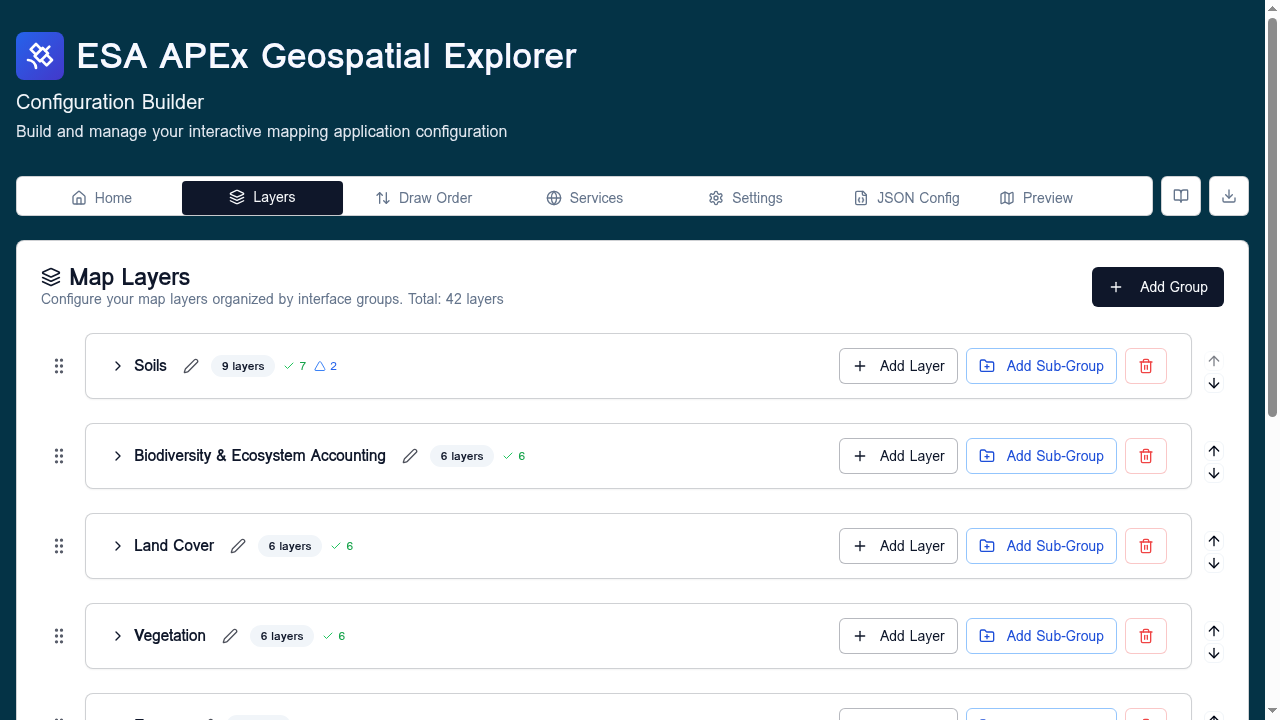
Screenshots on this page were taken with the Comprehensive demo config loaded.
Layer model
The definition of a layer comprises:
| Where it lives in the UI | An interface group (and optional sub-interface group) that determines where the layer appears in the Explorer's layer panel. |
| What it shows | One or more data sources — service+layer references or direct URLs to COG, GeoJSON, FlatGeoBuf, CSV, WMS/WMTS layers, etc. |
| How it is visualised | Style: colormap, RGB composite band assignments, vector styling rules, categorical classes. |
| Supporting content | Description, attribution, legend, units. |
| Functional controls | Opacity, temporal controls, zoom to layer, download link, layer toggles. |
| Advanced features | Statistics, constraints, charts. |
Layers are managed through Layer Cards. Each card represents one selectable item in the deployed Explorer's layer panel.
Layer types
The builder supports three layer types — Standard, Swipe, and Base — each with its own page under Layers. In short:
- Standard — toggleable user-facing data overlays. The default for almost everything.
- Swipe — two rasters compared under a draggable handle.
- Base — background basemaps picked from the basemap selector.
How the tab is laid out
The Layers tab uses a three-level hierarchy:
Interface Group
└── Sub-Interface Group (optional)
    └── Layer Card
        └── Data Source(s)
- Interface groups are managed in Settings → Interface Groups. They are the top-level structure shown to users (for example Land Cover, Soils, Climate).
- Sub-interface groups are declared per layer by typing a name in the layer's Sub-interface group field. The hierarchy renders automatically.
- Layer Cards sit inside groups. Drag them to reorder, double-click move buttons to jump to top/bottom.
- Data Sources sit inside layer cards. A simple raster layer has one; a swipe layer has two (left + right); an RGB composite has three or more.
Card actions
Each layer card surfaces a small toolbar:
- Edit — opens the full layer editor.
- Duplicate — clone the card into the same group.
- Delete — remove the card (you will be warned if it is the only one in its group).
- Move up / down — reorder within the group. Double-click moves to the top/bottom of the group.
The card itself shows the layer title, the interface group / sub-interface group it sits in, and metadata badges (data type, statistics availability, RGB composite, swipe, time-series).
Empty state
Before any layers exist the tab shows an empty-state panel inviting you to either Add Layer or load an example configuration from the Home tab.
Next steps
- Layers — overview of the three layer types and how to choose between them.
- Standard layers — including the Add a standard layer walk-through and the Import Layer Card flow.
- Swipe layers — side-by-side raster comparison.
- Base layers — basemap-specific guidance.
- Data visualisation — colormaps, RGB composite, vector rules, categories.