Statistics
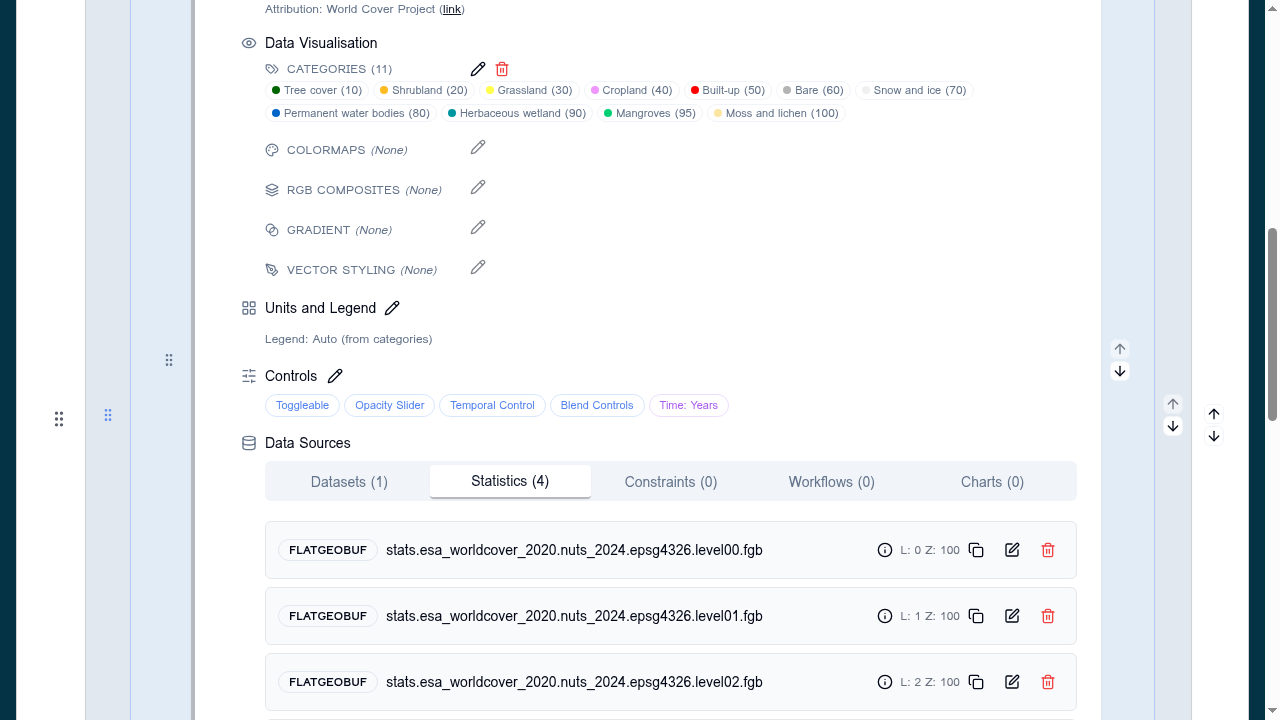
The Statistics section of a layer card configures additional raster sources used to compute summary statistics (mean, min, max, histogram) for the layer — typically over a user-drawn area of interest or a selected vector feature.
Statistics sources are separate from the layer's display sources: the user sees the styled layer on the map, but stats are computed from the underlying scientific raster (often a higher-precision COG) listed under Statistics.
When to use
Add Statistics sources when you want users to:
- Draw an AOI and see numeric summaries for that region.
- Click a vector feature and see per-feature statistics.
- Compare multiple variables (e.g. temperature, NDVI) over the same AOI.
If the layer is purely visual and no numeric summary is needed, leave Statistics empty.
Configure
In the layer card, expand Statistics and add one or more sources. Each entry uses the same DataSourceItem shape as the main data array:
- URL — link to the statistics raster (usually a COG).
- Format — almost always
cog. - Band index / min / max / units — optional metadata used when displaying results.
Set layout.layerCard.showStatistics: true to expose the Statistics panel in the viewer for this layer. The viewer's Feature statistics flag (hasFeatureStatistics) enables per-feature stats triggered by clicks on associated vector layers.
Validation
- Each statistics source must have a
urland aformat. - Bands referenced by
bandIndexmust exist in the COG. - The statistics raster should cover the same area as the displayed layer; mismatches yield empty results.
Related
- Data visualisation
- COG data sources
- Pixel-values charts — point-sampled equivalent.