Configuration Builder
The Configuration Builder is the companion tool to the Geospatial Explorer. Where the Explorer is the end-user application, the Configuration Builder is the no-code editor used to shape what an Explorer deployment looks like — which layers appear, how they are grouped, what styling and charts are attached, which storymaps are on offer, and so on.
You're using it right now. Before we start building anything from scratch, it helps to see a fully worked example so you have a mental picture of what a "finished" configuration contains.
Tasks
1. Load the Comprehensive Demo example
From the Configuration Builder home page, open the Examples dialog and choose Comprehensive Demo. This will load a rich, pre-built configuration into the editor — no changes you make will affect anything on disk unless you explicitly export.
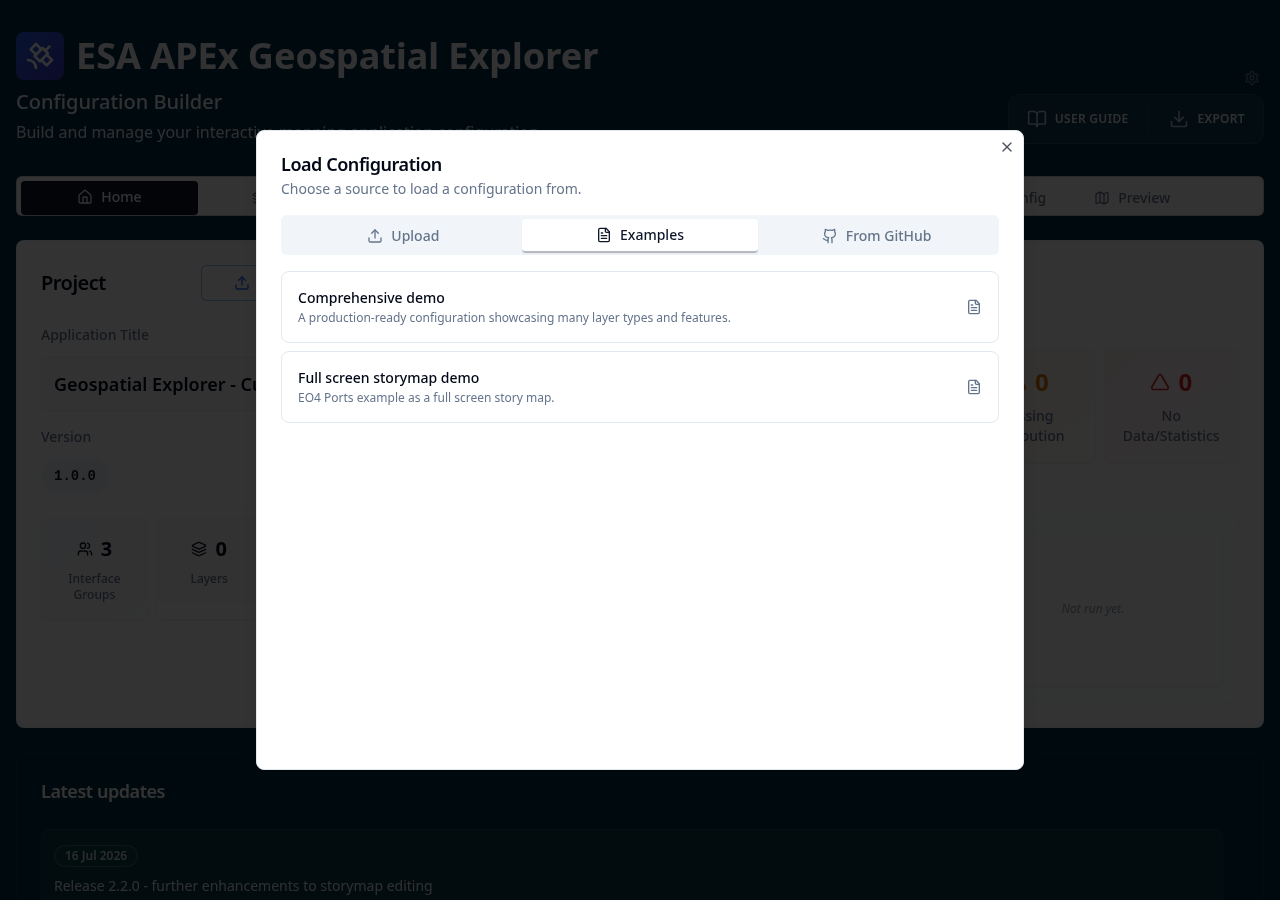
2. Open the Preview
Click Preview to launch the Geospatial Explorer against the demo configuration you just loaded. This is exactly the same Explorer application you looked at in the previous step, but now driven by the demo config rather than the reference deployment.
Have a quick click around to confirm it behaves as an end user would expect.
3. Switch back to the Configuration Builder
Close the preview (or switch tabs) to return to the Configuration Builder. This is where you'll spend most of the workshop.
4. Expand the layer groups and layers
In the Map layers section, expand the interface groups, then their sub-groups, and finally the individual layers inside. Each layer card reveals further sections — data source, data visualisation, charts, constraints, metadata, and more.
5. Have a look around
Take a few minutes to browse through what's configured. You don't need to understand every field yet — the goal is just to build up a sense of the shape of a configuration:
- How layers are organised into groups and sub-groups.
- The variety of data sources in use (STAC, COG, vector, WMS…).
- How styling and colormaps are attached to raster layers.
- Where charts and constraints hang off individual layers.
- Any storymaps, algorithms or global layout settings defined elsewhere in the sidebar.
By the end of this browse you should have a rough answer to the question "what kinds of things live in a configuration?" — which is exactly the foundation we'll build on in the next exercise.