Pixel values
The Pixel Values chart source renders a spectral signature — one trace per pixel sample, with band index on the X axis and pixel value on the Y axis — from a multi-band Cloud Optimized GeoTIFF on the layer.
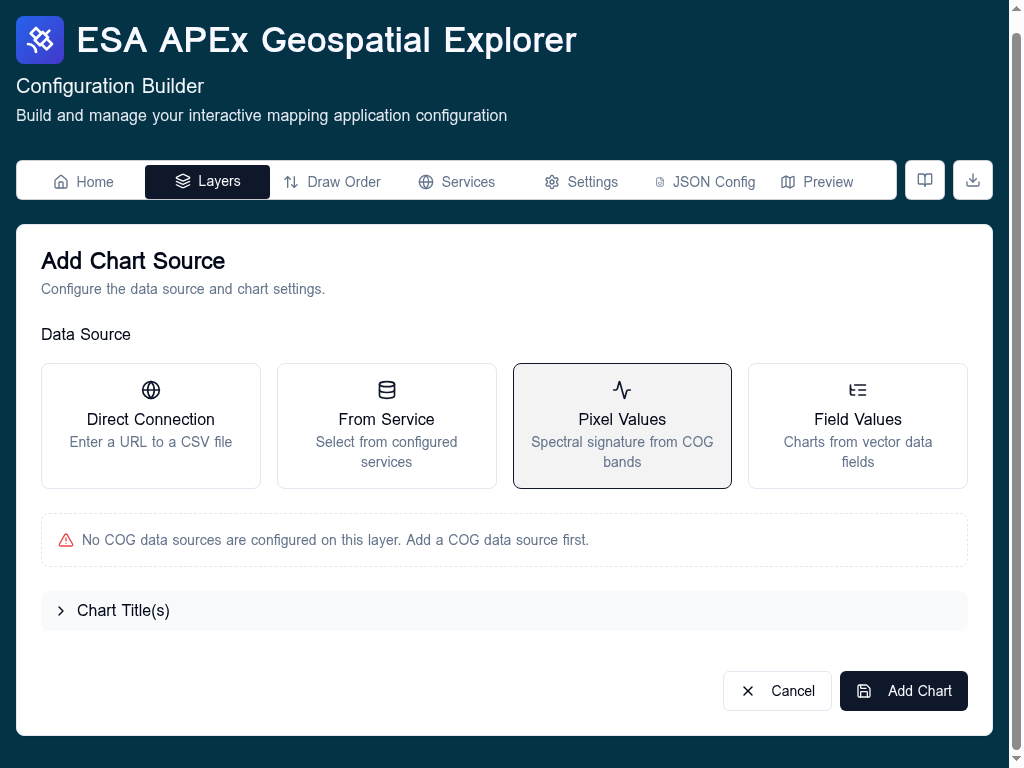
When to use
- Hyperspectral or multi-band imagery (Sentinel-2, Landsat, EnMAP, PRISMA).
- Letting users click a pixel and see its full spectral profile.
Configure
- Add at least one COG data source to the layer's Datasets tab. The Pixel Values source type is disabled until a COG is present.
- In the layer's Charts tab, click Add Chart and choose Pixel Values.
- The X axis is auto-populated with band labels read from the COG metadata (or
Band 1, Band 2, …if no labels are available). - Each Y trace represents one sampled pixel; the runtime adds a trace per click on the map.
Notes
- Performance guards limit metadata reads on very large hyperspectral COGs — see the COG performance guards memory.
- BSQ-interleaved COGs are detected and downloaded band-by-band; BIP COGs stream all bands together.