Categories
The Categories sub-section of the layer card's Data Visualisation panel styles rasters whose pixel values represent discrete classes (e.g. ESA WorldCover land-cover codes, soil type, administrative region).
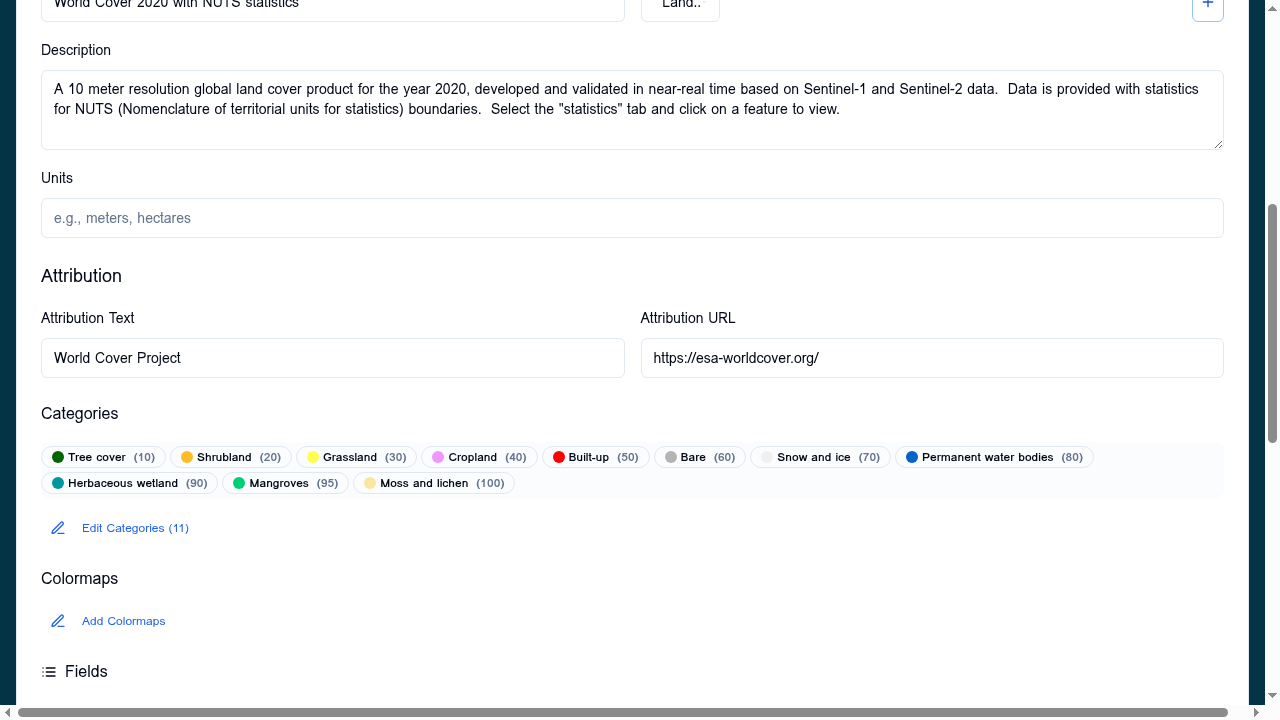
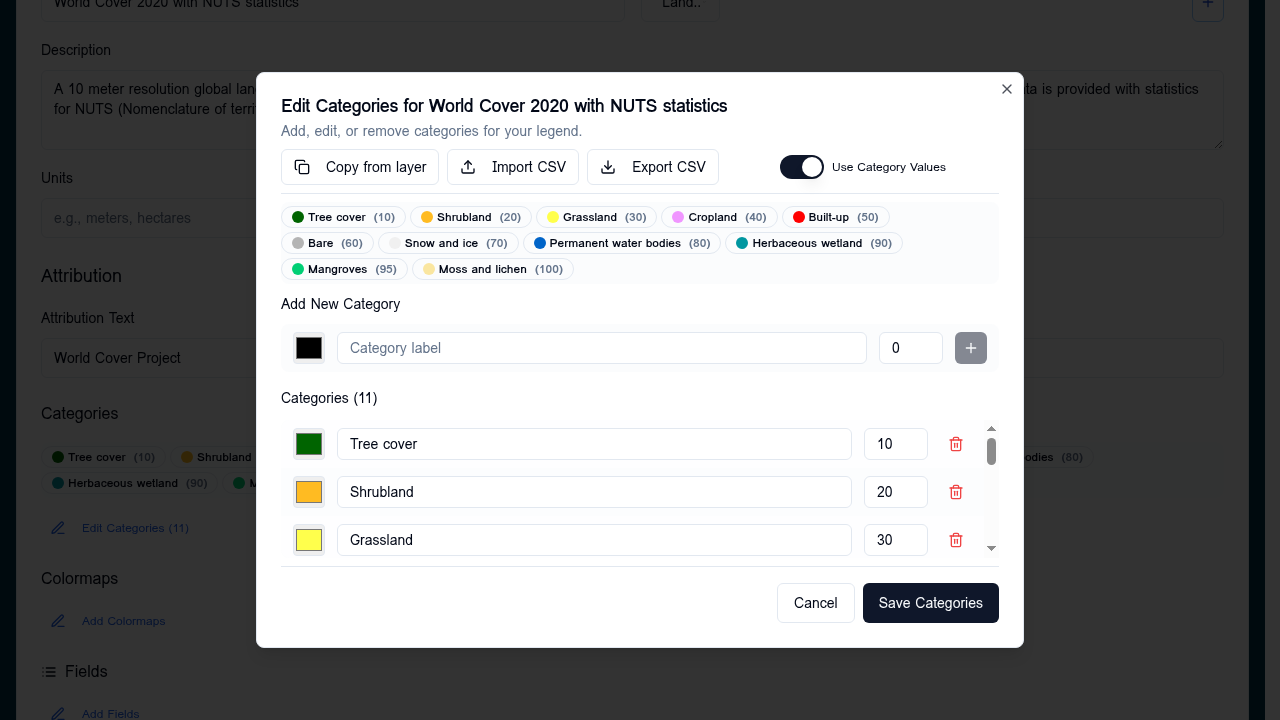
Each category row defines:
- Value — the pixel value (integer)
- Label — human-readable name (e.g.
Tree cover,Cropland) - Colour — fill colour for that class
Configuring categories
- Open the layer card → expand Data Visualisation
- Click the + next to Categories
- Add rows for each pixel value, or use Copy from another layer if a sibling layer already has the right categories
- Save — the badge in the layer card shows the category count (e.g.
11 classes)
Copy from another layer
The category editor includes a Copy from layer action that lists all layers with existing categories. Useful when several products share the same legend (e.g. multiple WorldCover years).
Tips
- Values not listed are rendered transparent
- Order is presentational only — the renderer matches by
value - Hex colours are normalised to
#rrggbbon save
When categories don't fit
- For continuous numeric values → use Colormaps
- For three-band imagery → use RGB composite
- For vector data → use Vector styling