Colormaps
The Colormap sub-section of the layer card's Data Visualisation panel styles rasters whose pixel values are continuous numeric (e.g. NDVI, elevation, temperature). A colormap maps the value range to a gradient.
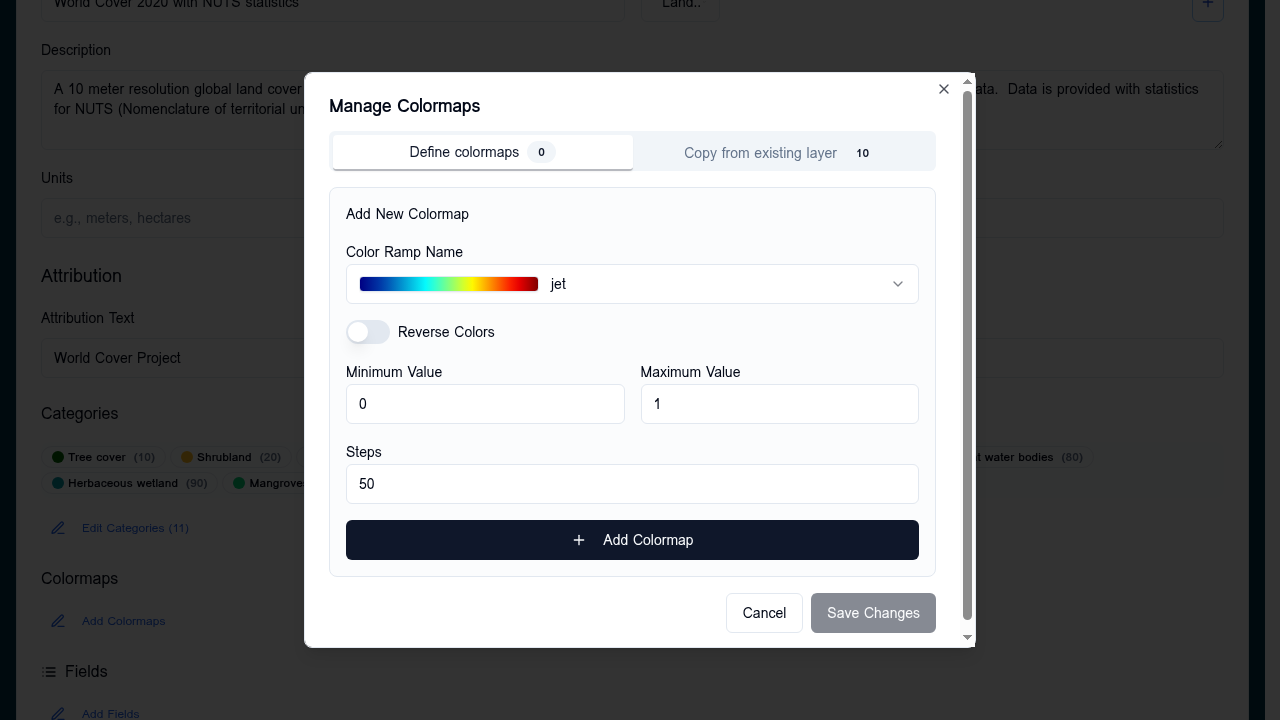
Configuring a colormap
- Open the layer card → expand Data Visualisation
- Click the + next to Colormap
- Pick a preset (Viridis, Plasma, Turbo, RdBu, …) or build a custom ramp
- Set the min and max of the input range — values outside are clamped
- Optional: enable reverse to flip the gradient
- Save
Custom ramps
Custom ramps are an ordered list of (stop, colour) pairs. The renderer interpolates linearly between adjacent stops. Use stops at 0 and 1 for a normalised input, or use the layer's value range directly.
Choosing a preset
| Data shape | Recommended preset |
|---|---|
| Sequential, low-to-high (NDVI, biomass) | Viridis, Plasma, Magma |
| Diverging around a midpoint (anomaly, change) | RdBu, BrBG, PiYG |
| Cyclic (aspect, phase) | Twilight, HSV |
| High-contrast / categorical-like continuous | Turbo |
When colormaps don't fit
- For discrete classes → use Categories
- For three-band imagery → use RGB composite
- For vector data → use Vector styling